Everything you need to know about the Reporting page in your TAP university dashboard
📈 What Is Reporting?
Reporting brings all of your TAP data together on one page, so you can quickly answer one simple question: for the dates you’ve picked, what happened to your students, content, spaces, ambassadors and acquisition – and how does that compare with another period?
To find it, head into your admin dashboard and click on Reporting in the sidebar. Everything lives on one page, split into tabs: Pinned, Overview, Engagement, Spaces, Acquisition, Students, Ambassadors, Impact and Prospects.
📅 How Do I Choose My Dates?
You’ll find three controls at the top right of every tab. They stay in place as you move between tabs.
Period preset – defaults to 30 Days. You can also choose 7 Days, 14 Days, This Month, Last Month, This Quarter, Last Quarter, This Year, Last Year, Last 12 Months or All Time.
Date range – shows the dates in use (e.g. 30/09/2026 – 29/10/2026). You can type or pick any custom range.
Comparison – after “vs”, choose Disable comparison, Previous period, Year over year or Custom period. Comparison is off until you turn it on, and Custom period adds a second date field.

Your period and comparison travel with you across tabs, and changing the dates reloads the tab you’re on. Not sure how to read the figures? Click on the orange Comparison Disclaimer link next to the comparison dropdown.
📊 How Does Period Comparison Work?
When comparison is turned on, you’ll see the change next to each comparable number:
Green with an up arrow – the value went up (e.g. +30.6%)
Red with a down arrow – the value went down (e.g. -81.4%)
Grey 0.0% – no change
N/A – the change can’t be calculated because the comparison period had zero for that metric. This doesn’t mean any data is missing – a jump from zero simply can’t be shown as a percentage.
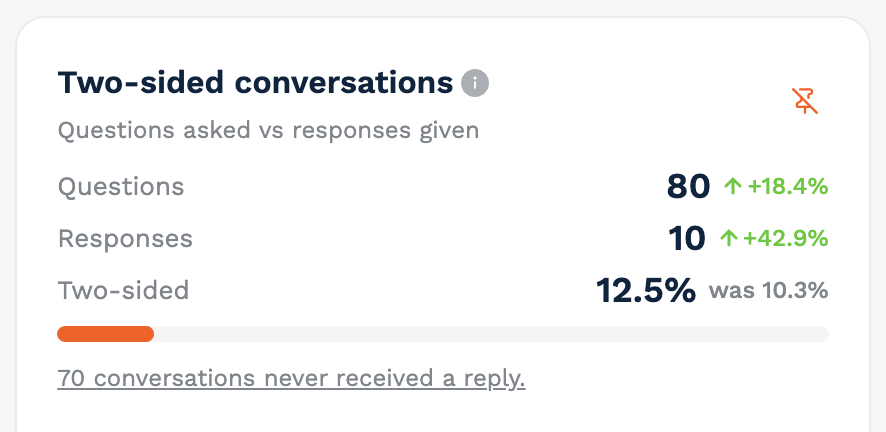
“was …” – metrics that are already percentages, such as a conversion or response rate, show the earlier value instead of a change (e.g. 12.5% was 10.3%)
Median first-response time is the one exception. Faster is better, so a decrease shows in green and an increase shows in red.
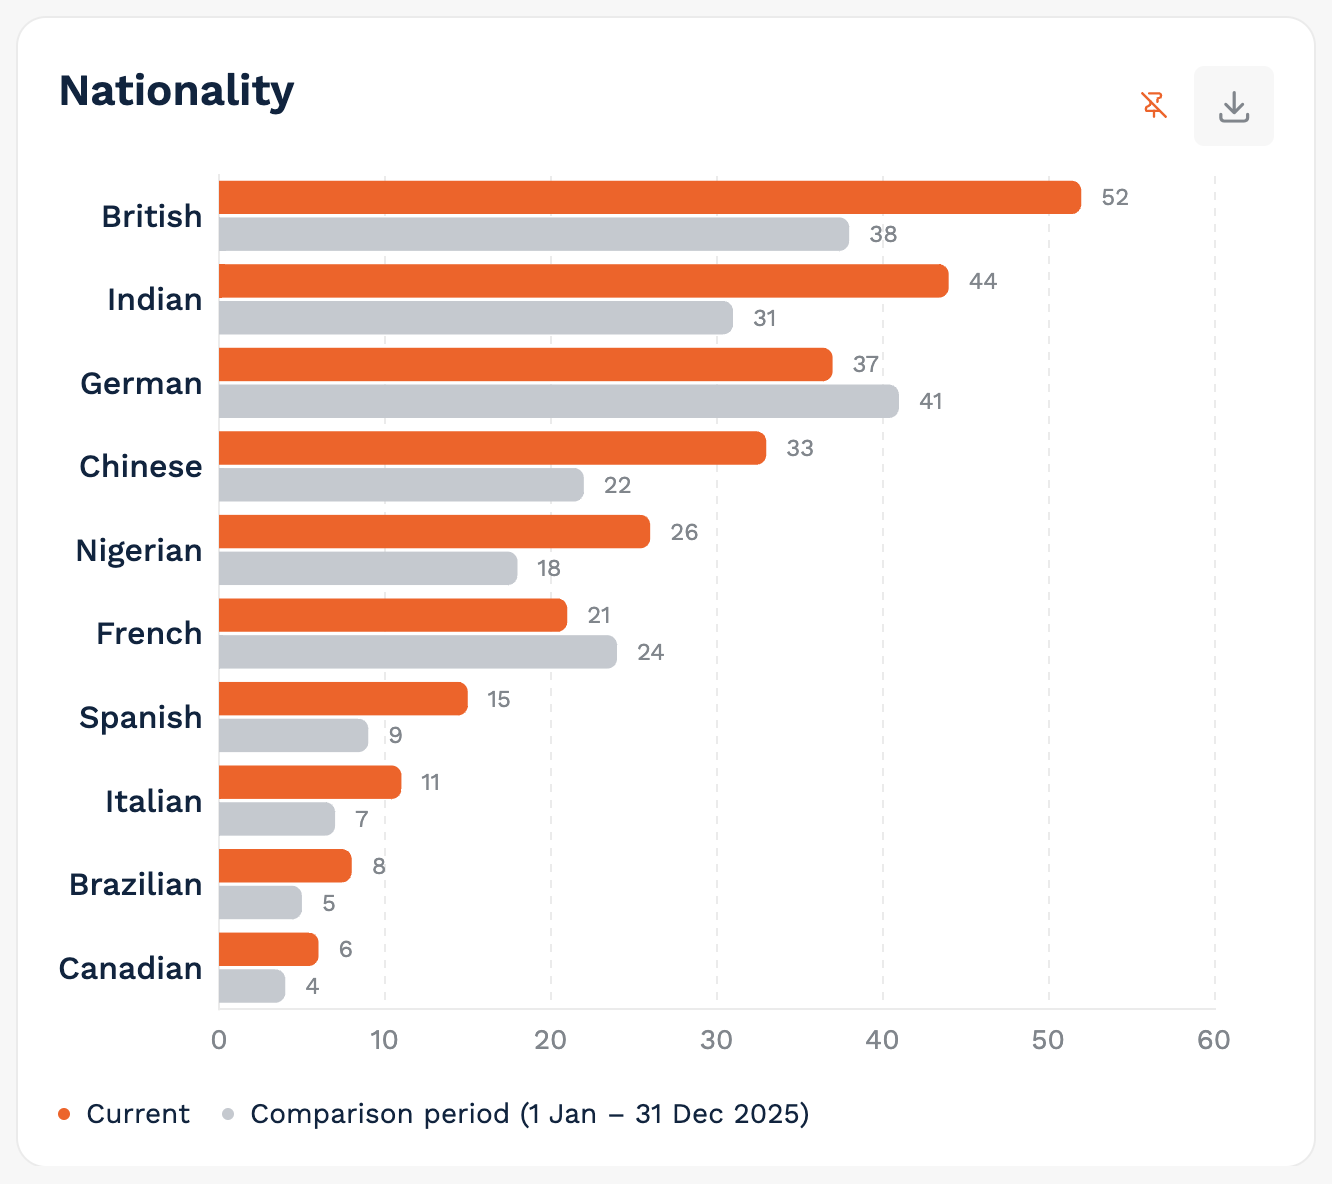
In charts, the comparison period appears as a second series – a dashed line in line charts and a second bar in bar charts – and the legend names the comparison dates. The funnel also adds a vertical marker for the comparison period.
Not every widget supports comparison. Those that don’t will keep showing the main-period numbers, along with a note on the widget: “Period comparison is not available for this widget. Values show the main period only.” Engagement levels uses its own wording: “Engagement levels show the latest scoring snapshot. Period comparison is not available for this widget.”
Which Comparison Period Should I Choose?
Previous period – for 7, 14, 30 Days and Last 12 Months, this is the same number of days immediately before. For This Month, Last Month, This Quarter, Last Quarter, This Year and Last Year, it’s the previous calendar period.
Year over year – the same dates one year earlier.
Custom period – any comparison dates you choose.
Please note that with All Time, only Disable comparison and Custom period are available. If you’ve typed in your own date range rather than using a preset, Previous period and Year over year won’t be available – just use Custom period instead.
⚙️ Can I Customise the Page?
Yes! The tab row is your personal layout, so you can set it up in the way that works best for you.
Reorder tabs – drag any tab by its grip to move it. Pinned always stays first.
Hide tabs – open a tab’s ⋯ menu and choose Hide this tab.
Restore tabs – once you’ve customised the row, a control on the right shows a plus and the number of hidden tabs. Open it to bring a tab back, or choose Reset to default.
Pin cards – almost every card has a pin icon (Pin to dashboard / Unpin). Pinned cards are collected on the Pinned tab.
📌 Pinned
The Pinned tab is your own dashboard of the widgets you care about most. You’ll see how many widgets you’ve pinned, along with a reminder that you can drag them to reorder. Cards sit on a two-column grid, and wide cards stay full width.
Haven’t pinned anything yet? You’ll see “Nothing pinned yet” and a button to start from Overview.
How To Download Your Pinned View
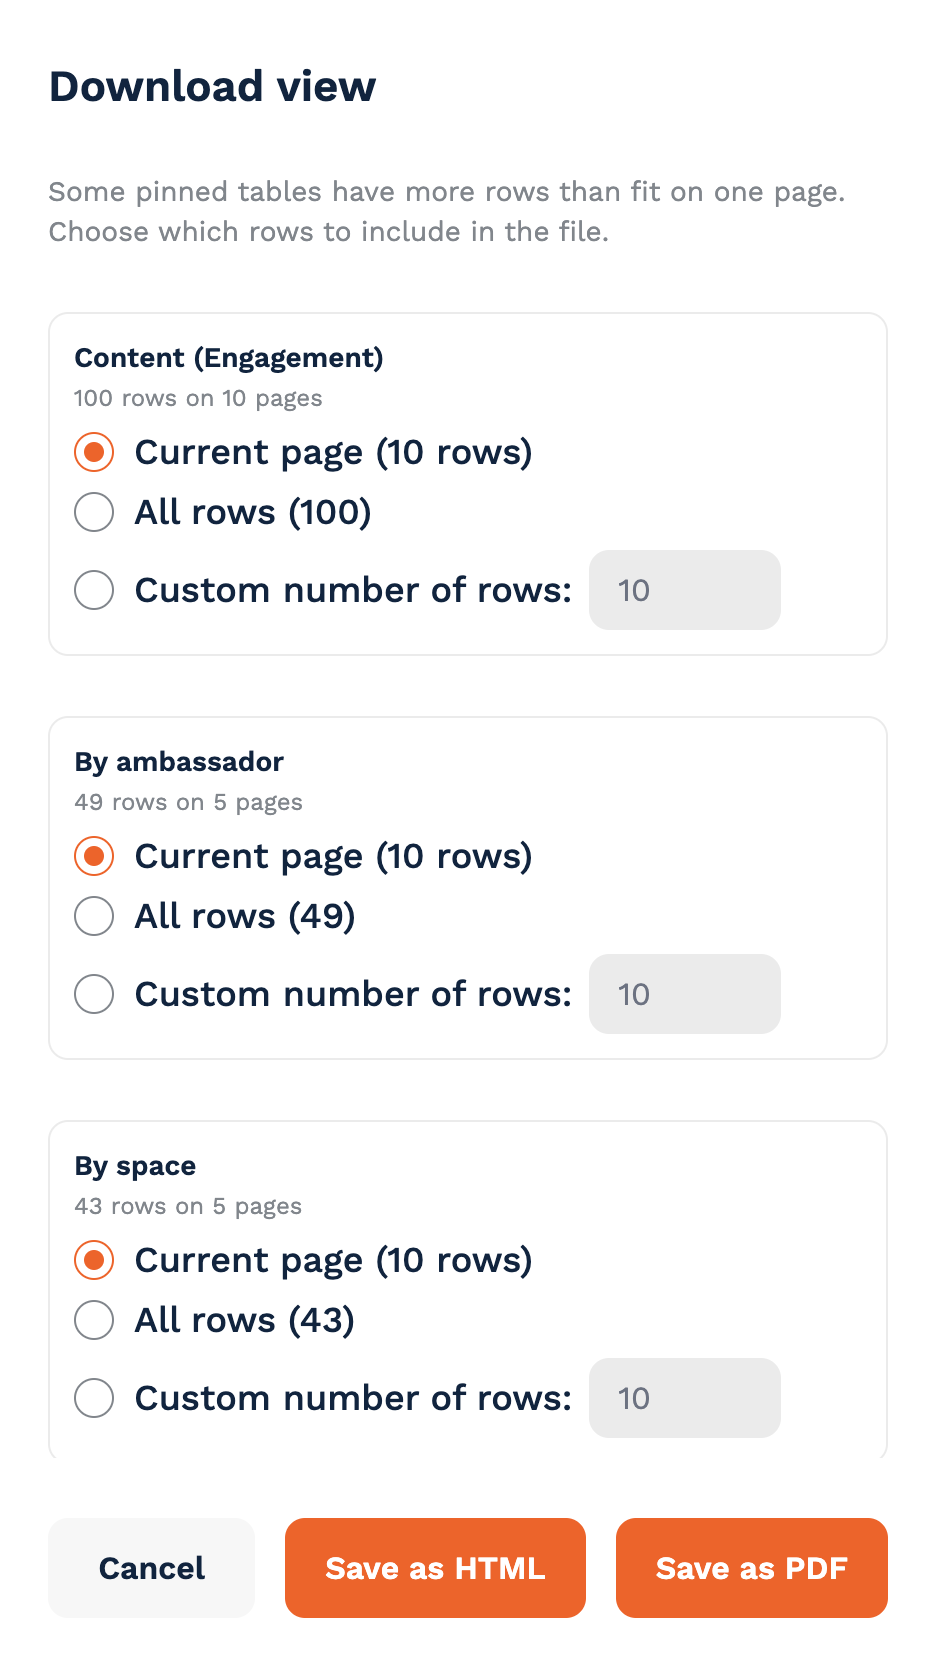
Click on Download view.
For each pinned table with more than one page of rows, choose Current page, All rows or a Custom number of rows (or Selected rows, if you’ve selected some).
Save your export as a PDF or HTML file.
The export header shows the period, and the comparison period when comparison is turned on.
🧭 Overview
The Overview tab tells the story of your student journey in four tiles and two charts.
Students reached – daily unique visitors who saw the TAP feed or the carousel. A visitor who returns on several days is counted once per day. Pop-card and tracked-link views aren’t included.
Students registered – prospects who registered for your university in the period.
Students engaged – registered prospects who watched, liked or bookmarked content, took part in a chat, or joined a live stream. Updated daily.
Students connected – registered prospects who started a one-to-one chat. This can never be higher than Engaged. Updated daily.
Funnel – reached → registered → engaged → connected, with each step shown as a count and a percentage of the step above.
Funnel trend – the same four steps over time, with a dashed twin line for each when comparison is on.
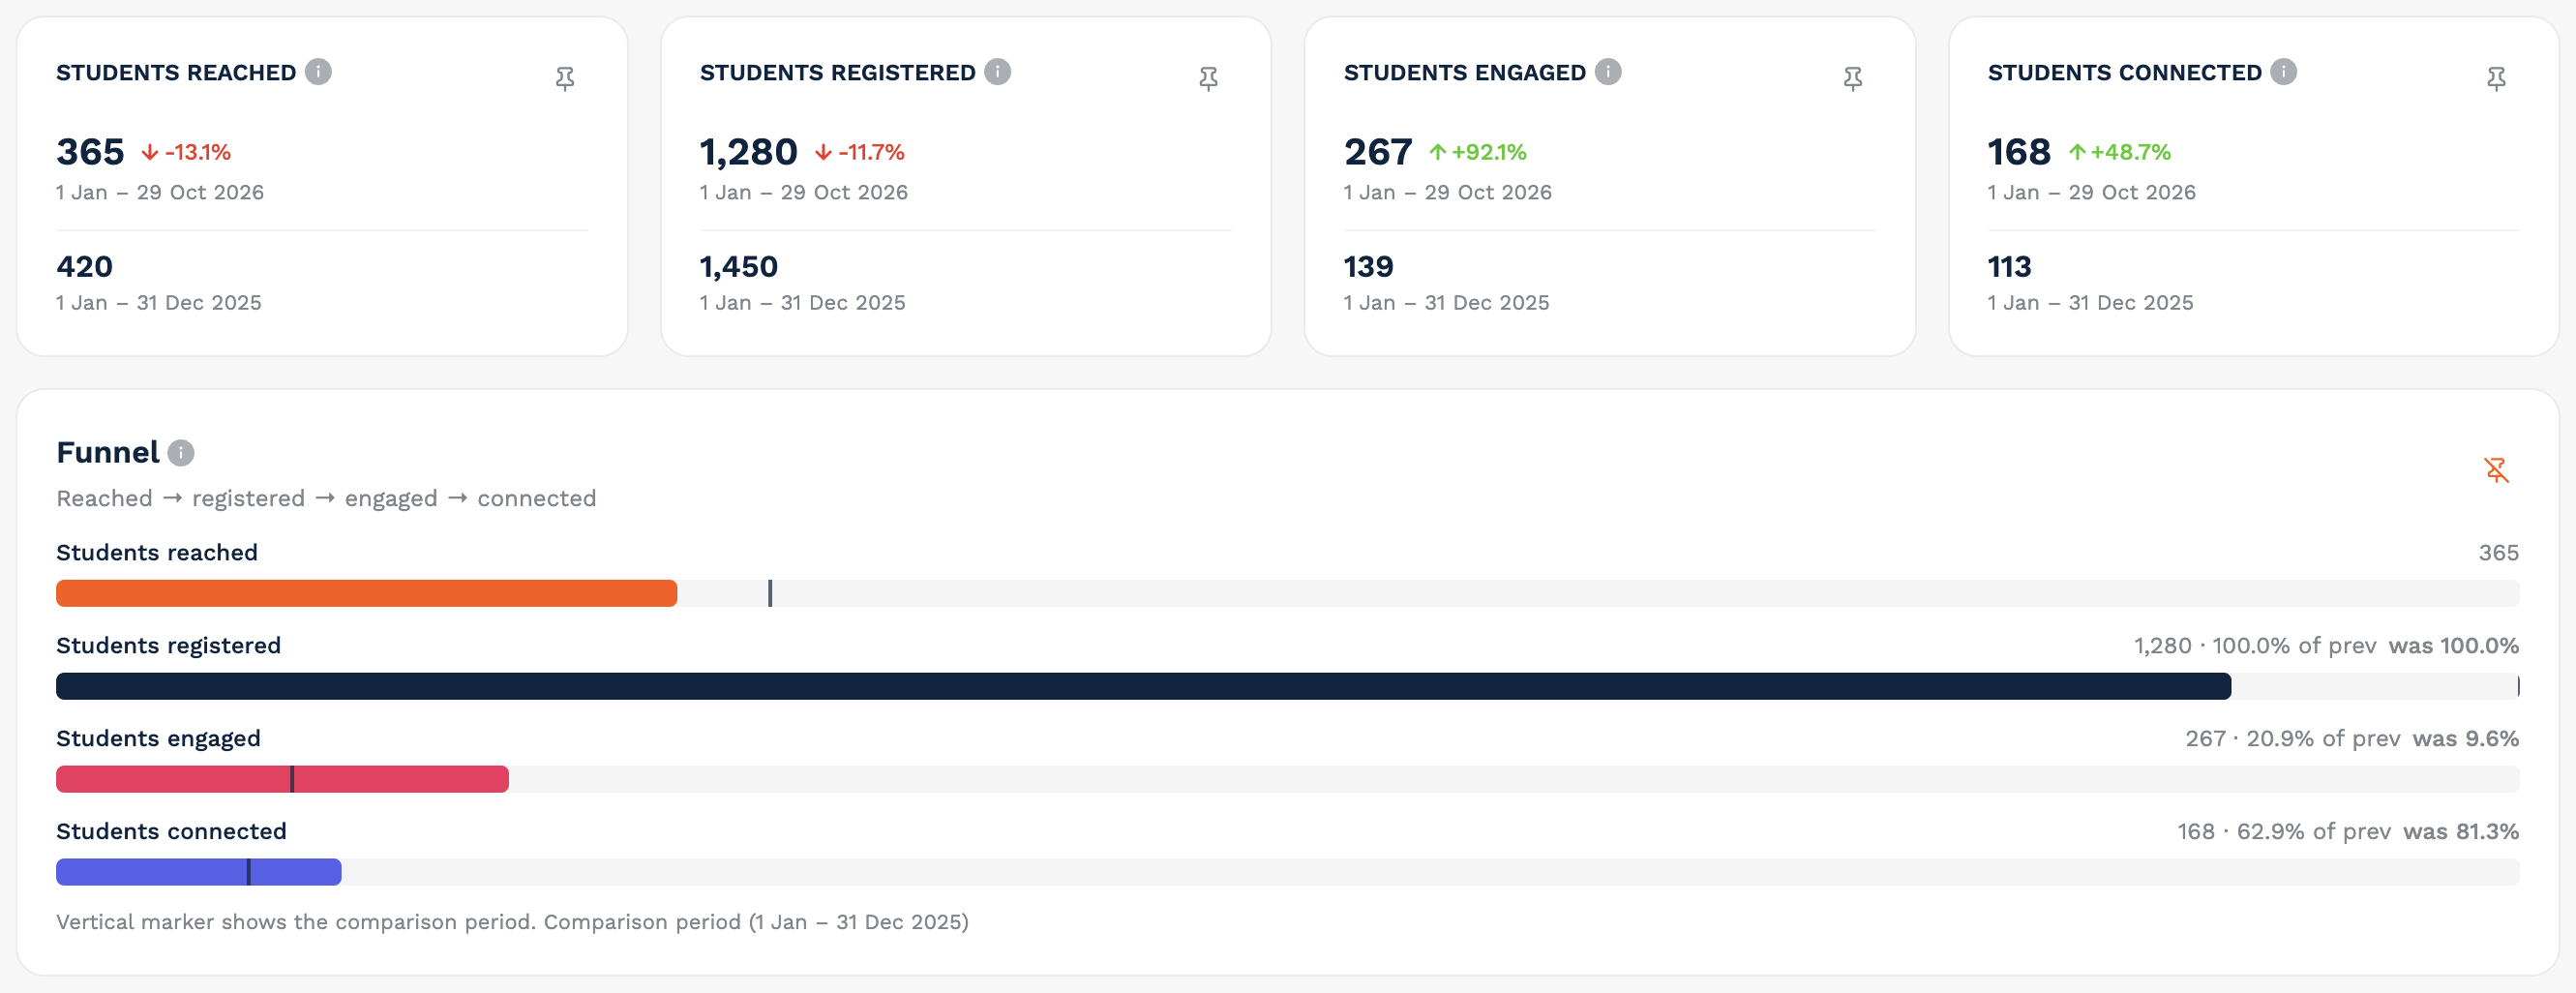
Registered, engaged and connected are the same people narrowing down. Reached counts anonymous visits, so registrations that come from the app or a direct link can sometimes be higher than reached.
💬 Engagement
The Engagement tab shows how students are interacting with your ambassadors and content. You can filter by Journey stage, Nationality and Space.
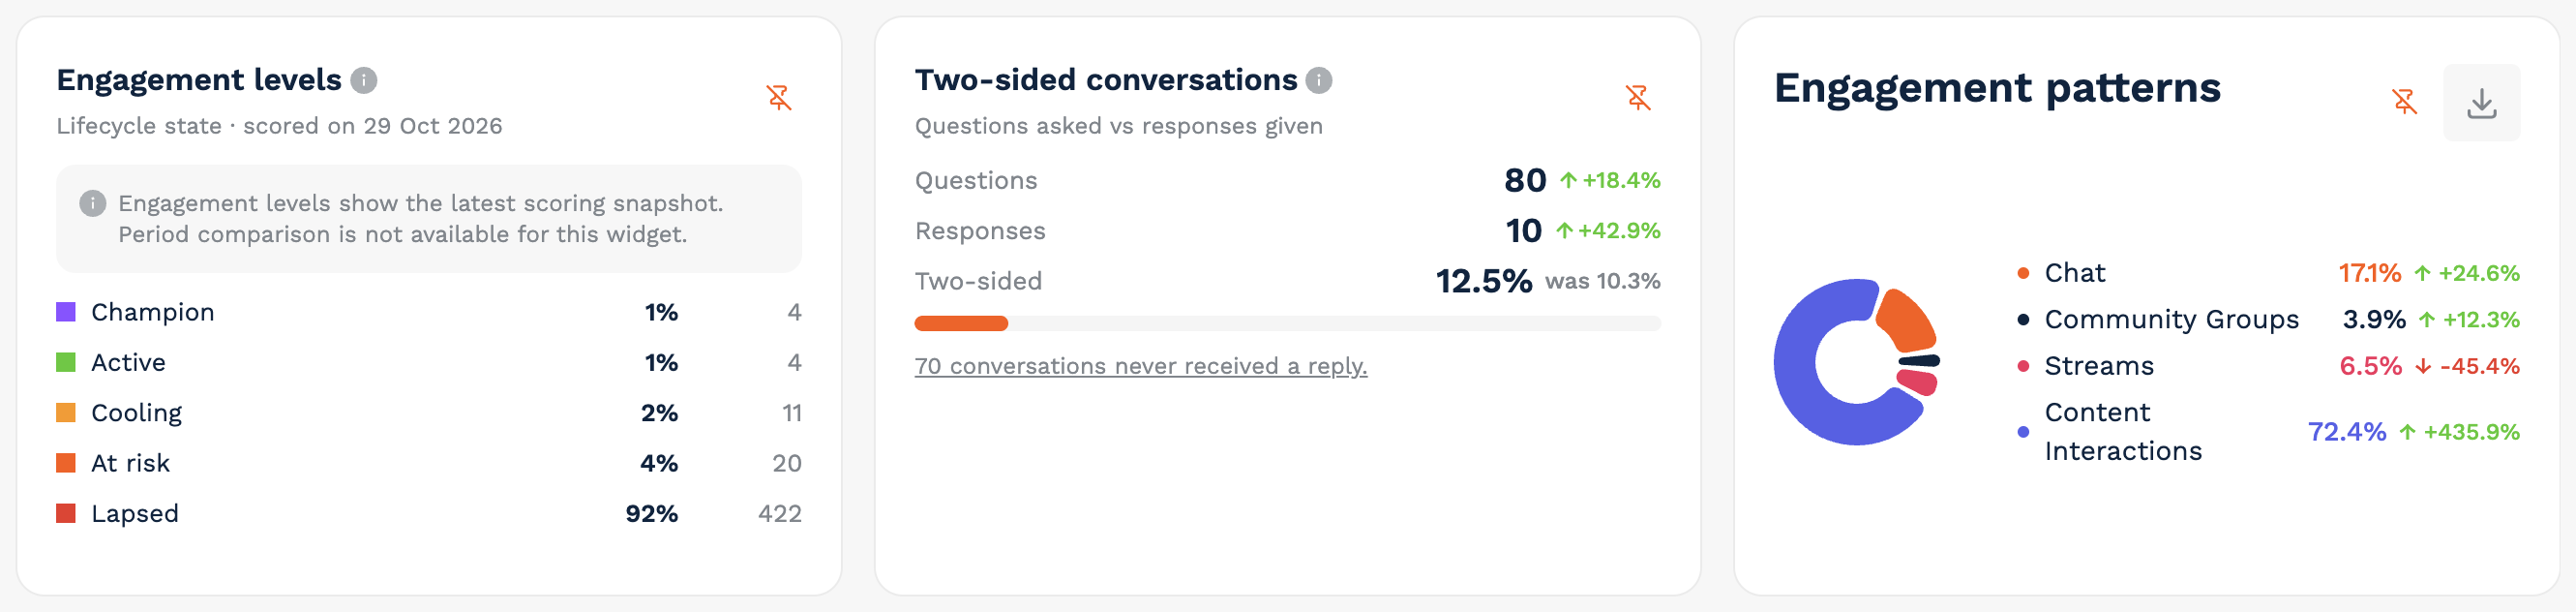
Engagement levels – students by lifecycle state (e.g. Champion, Active, Cooling, At risk, Lapsed) from the latest completed scoring run, with the scoring date shown. These numbers ignore the date range and can’t be compared.
Two-sided conversations – questions asked versus responses given. A chat counts when it started in the period and includes a student message. It becomes two-sided once an ambassador has replied (automatic welcome messages don’t count). A link shows how many conversations never received a reply and opens the list.
Engagement patterns – how student activity splits between Chat, Community Groups, Streams and Content Interactions.
FAQ likes and FAQ shares – activity on your FAQs.
Content – posts students viewed, engaged with or commented on, with Views, Engagements (likes, bookmarks, shares) and Comments. Click on a comment count to read the comments.
Streams – completed and on-demand streams that started in the period, with Sign-ups and Participants. Stream names open the stream if you have access to view it.
Please note that FAQ shares aren’t linked to students, so they’re unavailable when a journey-stage or nationality filter is on.
🏘️ Spaces
The Spaces tab shows activity across your community spaces. Use the Space filter to focus on specific spaces. If nothing is selected, the page covers all of your university’s spaces except the default admin/ambassador space, and content with no space is treated as Public.
Members, Conversations and Messages – three tiles for the period.
By space – one row per space with Invited, Members, Conversations and Messages.
Topics mentioned – up to 10 topics, ranked by how many conversations mentioned them. With comparison on, each topic has a second bar for the comparison period.
Most active group chats – ranked by messages, with the space, participants and messages.
Content – posts in the selected spaces, with Date published, Views, Likes, Shares and Comments.
Streams – the same table as on the Engagement tab. Comparison isn’t available for this card.
🚀 Acquisition
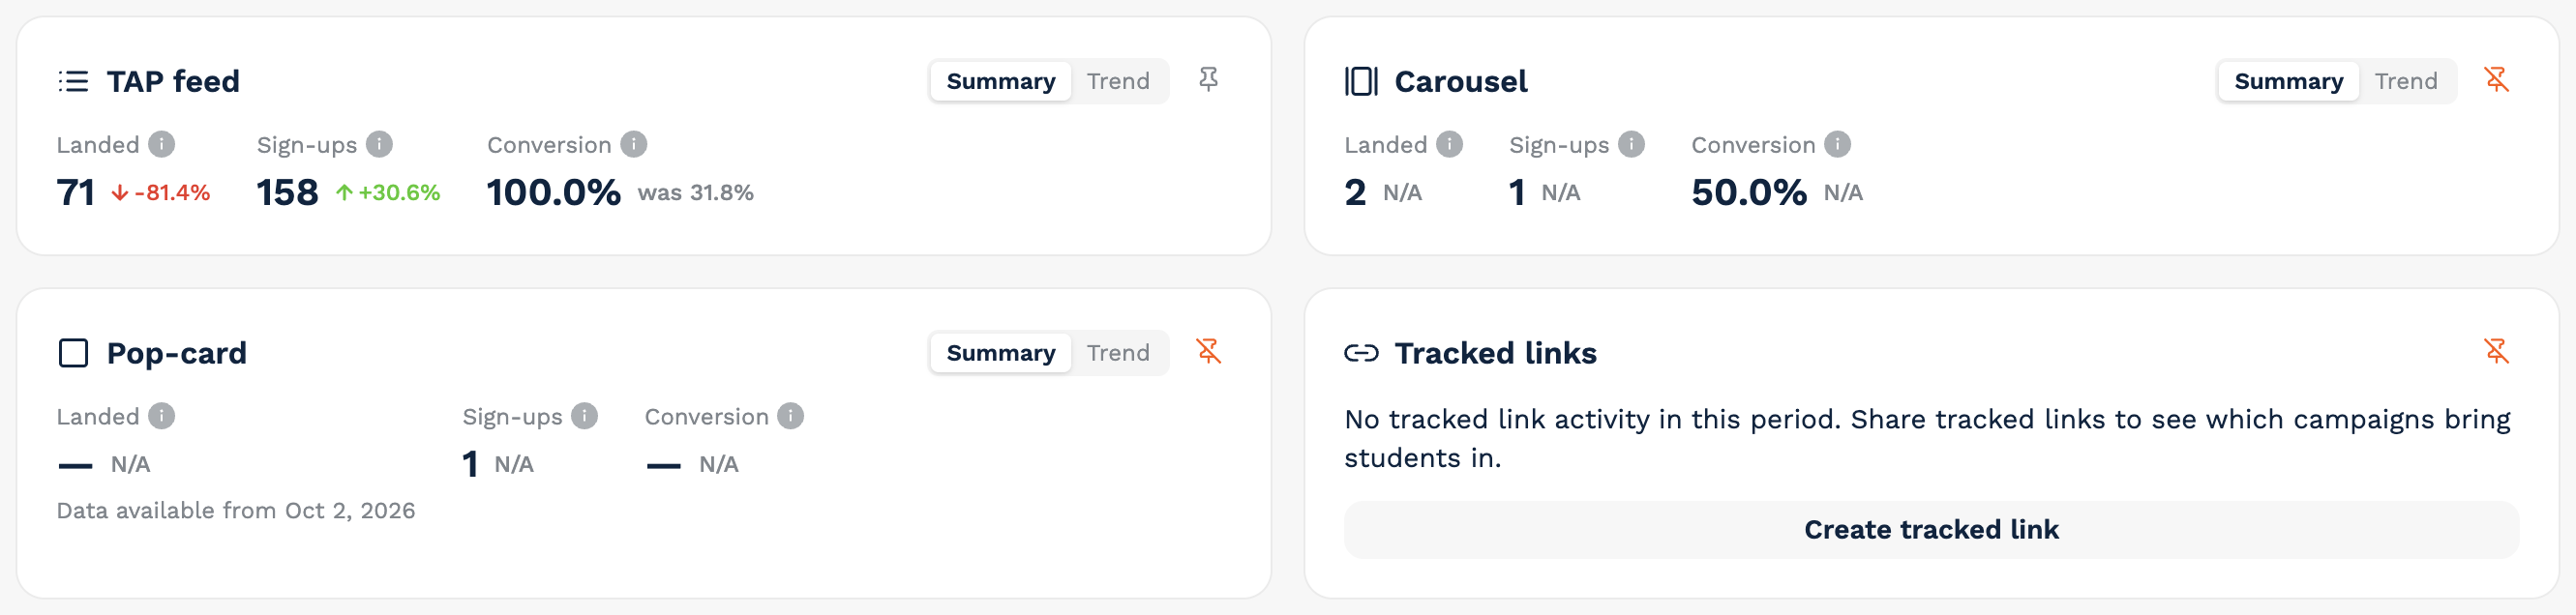
The Acquisition tab shows where your students come from, across four channels: TAP feed, Carousel, Pop-card and Tracked links. Each card has two views:
Summary – Landed, Sign-ups and Conversion
Trend – plots Landed and Sign-ups over time, and expands the card to full width
Good To Know
Each channel counts its own visits and sign-ups, so nothing is counted twice across cards.
QR-code visits and sign-ups belong to the TAP feed card.
Pop-card and tracked-link landed data starts on 2 October 2026. Earlier visits aren’t included, and the card will let you know.
If a channel has no activity yet, you’ll see an empty state with a button to get started: Create promotion, Create carousel, Create pop-card or Create tracked link.
🎓 Students
The Students tab helps you understand who your students are. You can filter by Journey stage, Study level, Nationality, Subject interest, Space, Campaign and Source.
Journey stage and Study level – doughnut charts showing the share of each group and how it changed versus the comparison period.
Nationality and Subject interest – top-10 bar charts, with a comparison bar when comparison is on.
What students are trying to resolve – categories detected in chats, followed by the top topics mentioned.
Each chart can be pinned or downloaded.
🤝 Ambassadors
The Ambassadors tab shows how your ambassadors are performing.
Response rate (avg) – the average share of each ambassador’s one-to-one conversations that received a reply.
Response time (median) – the median time to the first ambassador reply. Lower is better, so a decrease shows in green.
Content created – content pieces created by ambassadors, excluding deleted content.
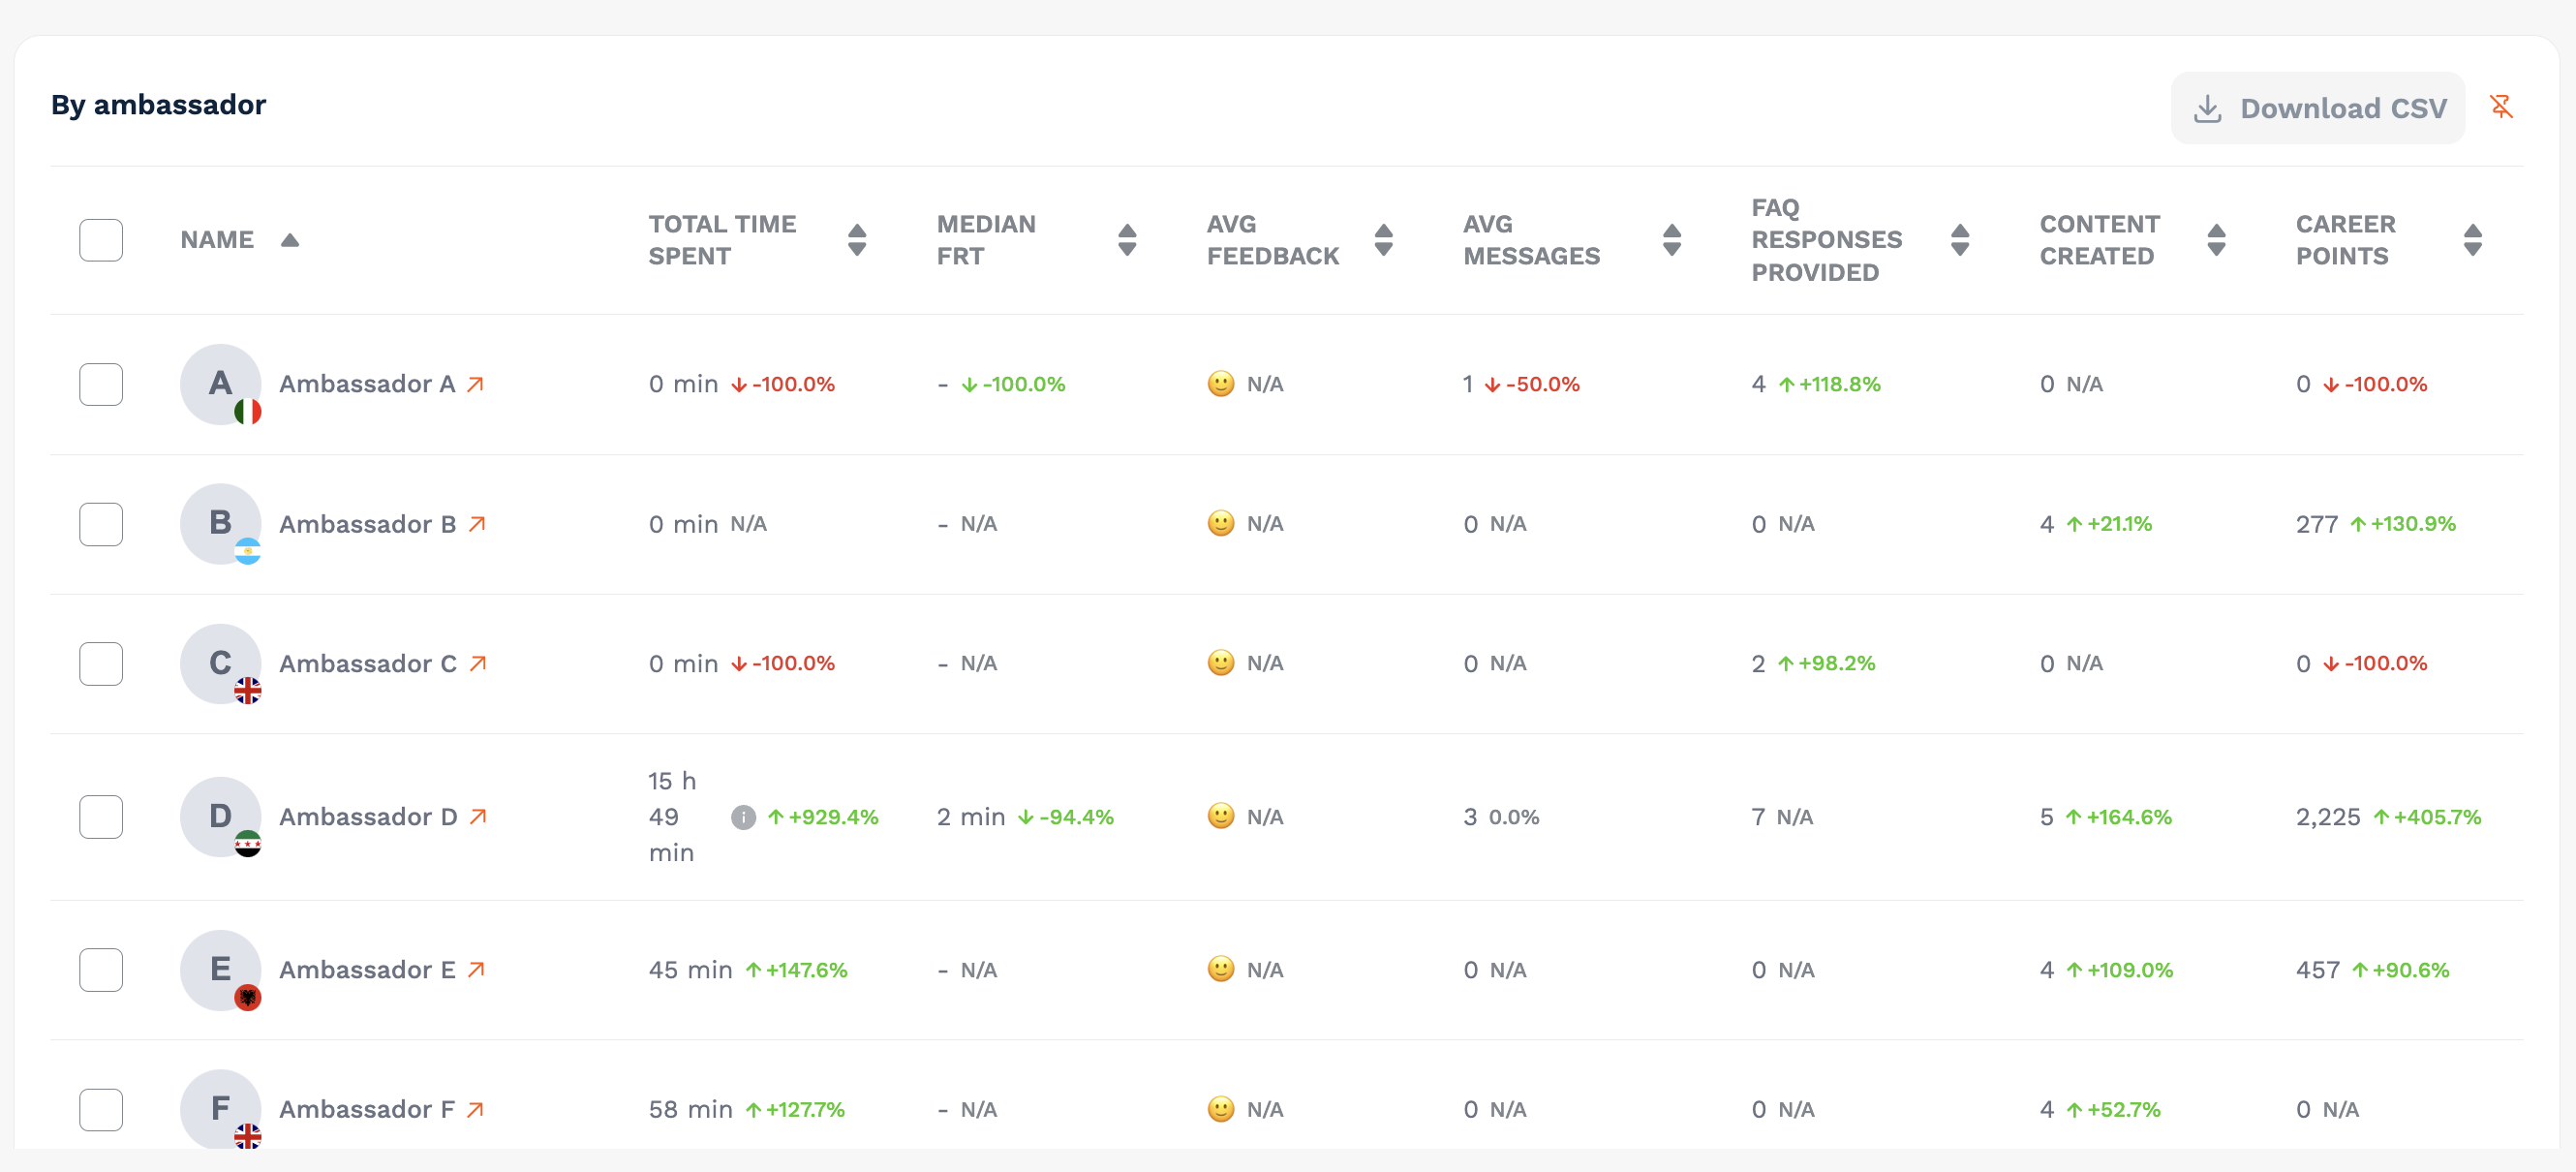
By ambassador – a table with Total time spent, Median FRT, Average feedback, Average messages, FAQ responses provided, Content created and Career points. Names link to the ambassador’s profile, and you can select rows to download a CSV.
Time Reporting
Please note that time reporting is only shown to users who can manage ambassadors.
Weekly usage report – time per ambassador by Chat, Content, FAQ and Live events, plus Time spent, Time deducted, Time merged, Rolled over and Weekly limit (used/limit). Only weeks that fall fully inside the selected range can be chosen.
Activity log – each counted action with time, points, last updated and created date. You can filter by activity type, download it as a CSV, and edit the time counted directly in the cell.
Comparison isn’t available for these two cards.
🌱 Impact
The Impact tab shows the outcomes of your TAP programme.
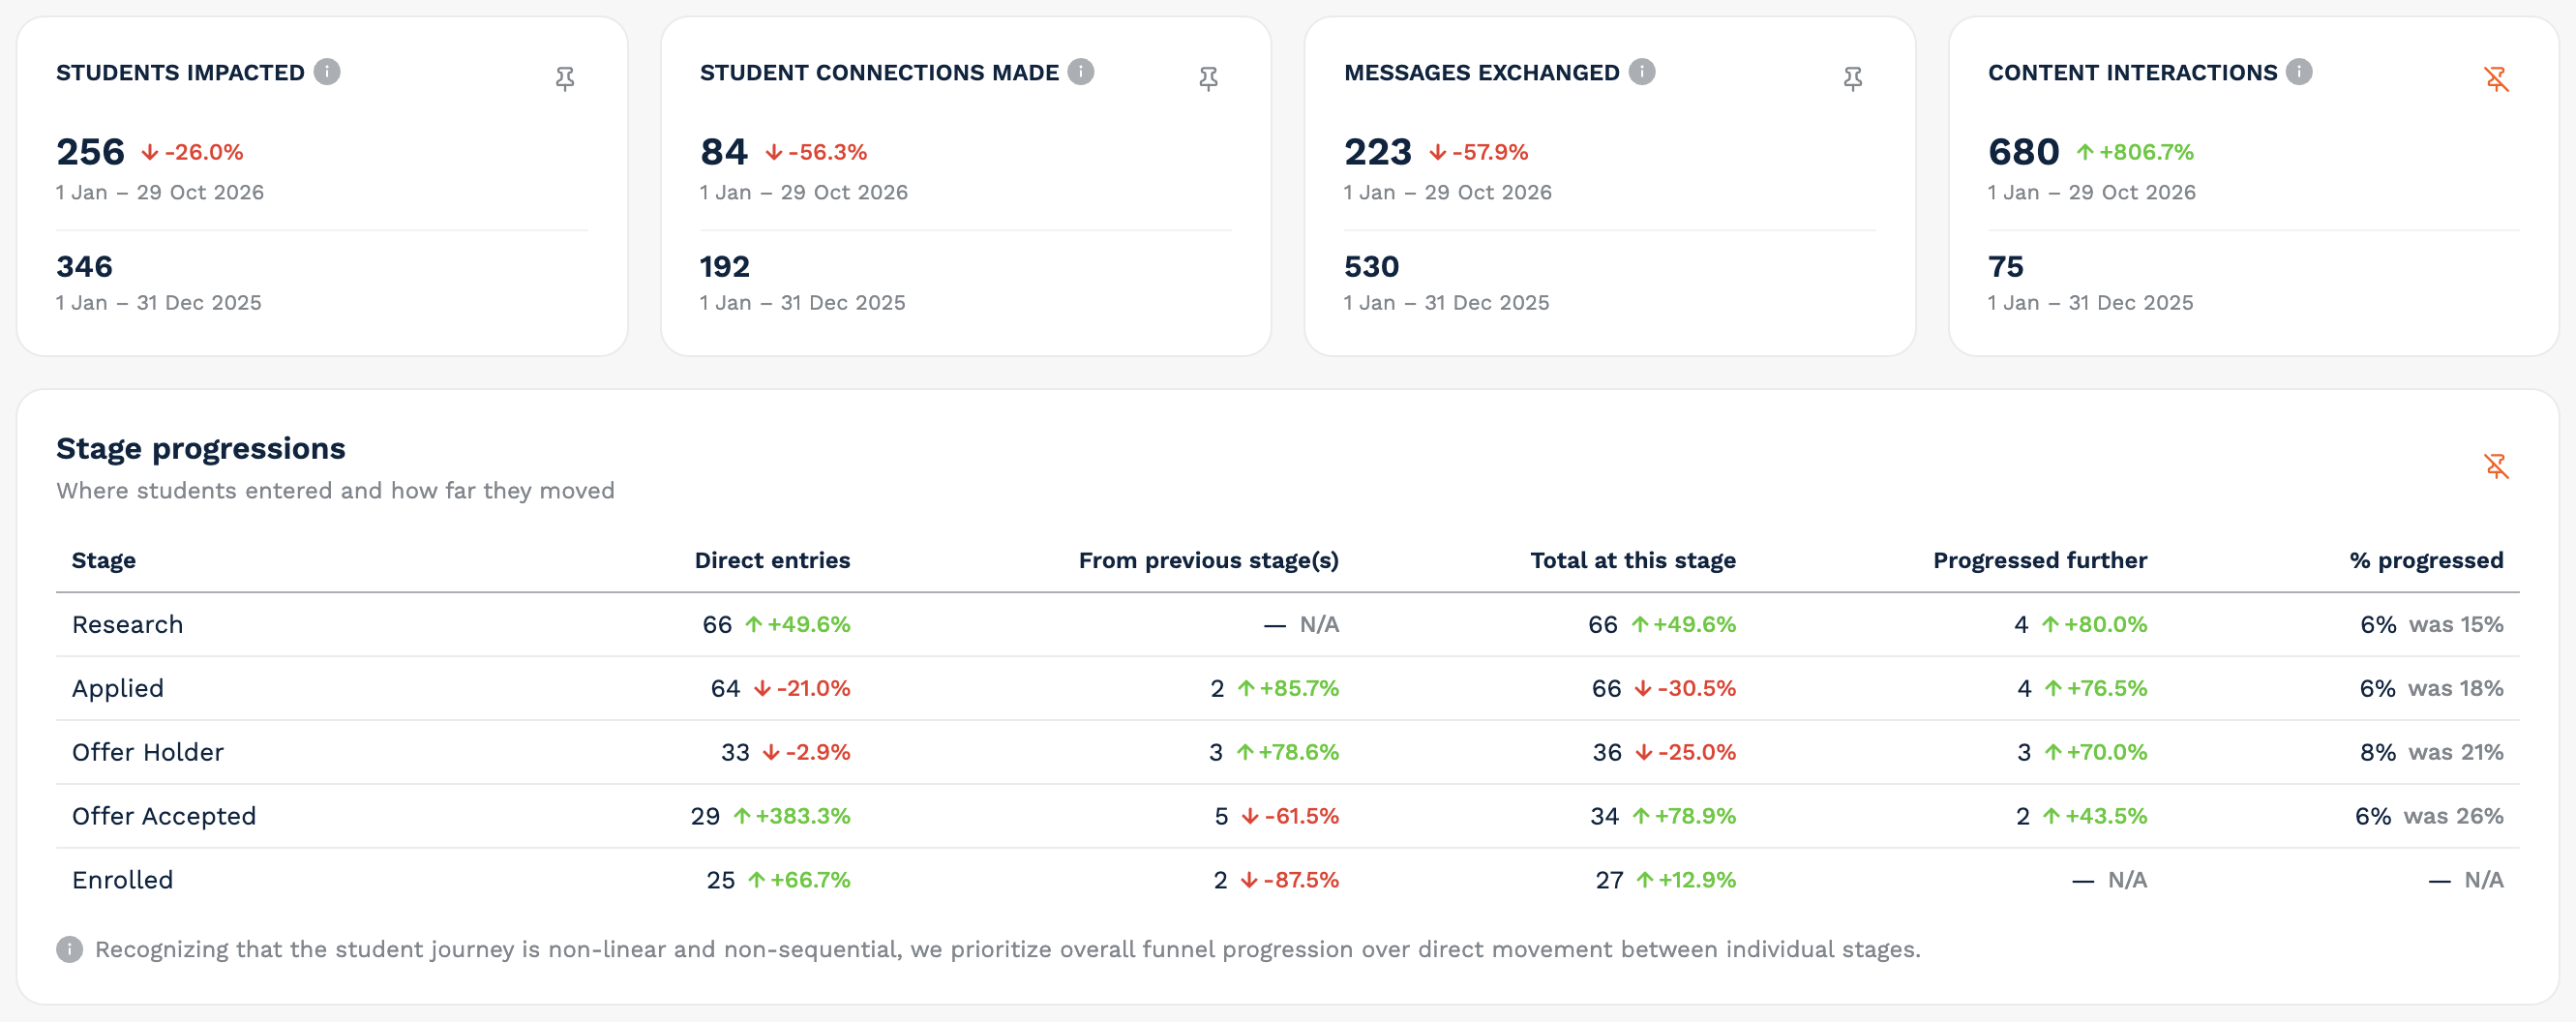
Headline counts – Students impacted, Student connections made, Messages exchanged and Content interactions, each with its comparison period underneath.
Stage progressions – where students entered and how far they moved through your funnel. For each stage, you’ll see:
Direct entries
From previous stage(s)
Total at this stage
Progressed further
% progressed
Impact on student experience – self-reported statements for the Research, Applied and Offer Accepted stages, each shown as a percentage of students at that stage. Stages with no responses yet show “No data yet for this stage.”
What students said – student feedback, which users who can manage prospects can export as a CSV. Comparison isn’t available.
ROI banner – shows the date range and lets you know that ROI needs your cost inputs before it can be included. If you also have access to the older reporting, you can Calculate ROI and Download report.
TAP recognises that student journeys are often non-linear. That’s why Stage progressions focuses on overall funnel progression rather than movement between individual stages.
👥 Prospects
Please note that the Prospects tab is only shown to users who can manage prospects.
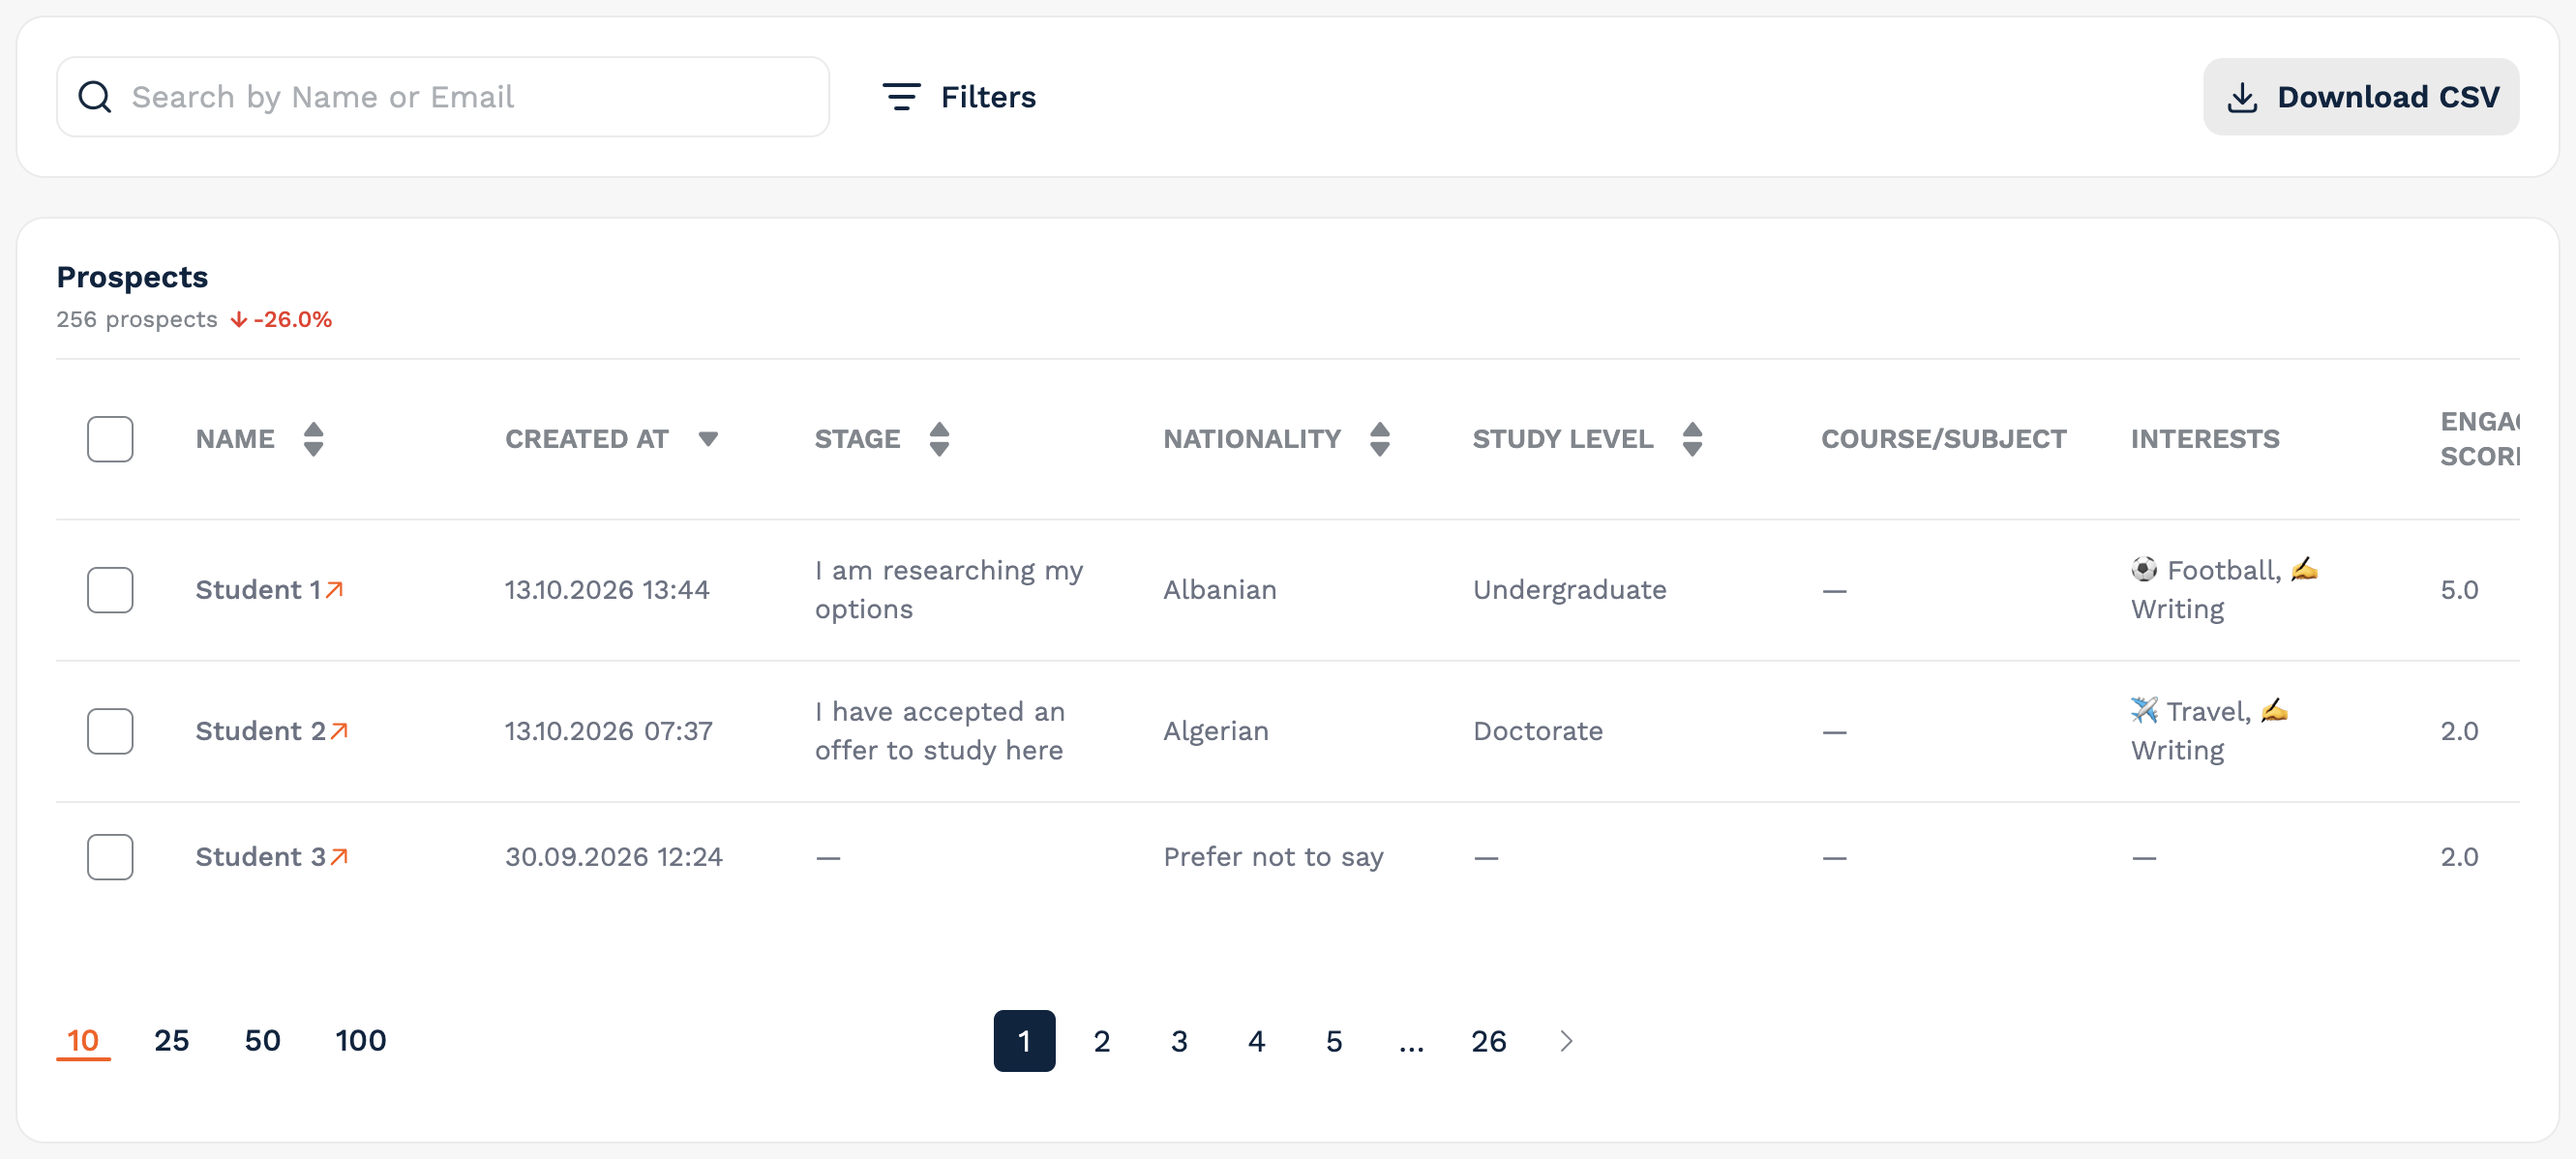
Rather than charts, the Prospects tab gives you a list of students for the selected period. The heading shows your prospect count, with the same green/red comparison as other metrics.
Find people – search by name or email, or open Filters to narrow down by Stage, Nationality, Study level, Course/Subject, Interests, Space, Campaign, and options such as marketing opt-in and mobile app users.
Read the table – name, created date, stage, nationality, study level, course/subject, interests and engagement fields (score, level, scoring points, days inactive).
How To Download Your Prospects
Click on Download CSV.
Choose who to include: selected prospects, prospects matching your filters, or all prospects for the period.
Choose which column groups to include.
Download your file.
✅ At a Glance: What Compares and What Doesn’t?
Compares – Overview tiles, funnel and funnel trend; Engagement patterns, two-sided conversations and FAQ tiles; Spaces tiles, tables and charts; Acquisition cards; Students charts; Ambassadors tiles and table; Impact counts and stage progressions; and the Prospects count.
Doesn’t compare – Engagement levels, the Streams card on Spaces, time reporting (weekly usage and activity log), and What students said. Each of these shows a note on the widget.
🎥 Watch the Video Walkthrough
Prefer to see it in action? Watch the video below for a quick walkthrough of Reporting 2.0.
If you have any questions about Reporting, please don’t hesitate to reach out via the Help Center on your dashboard.